Interactivity
There are several ways to interact with our demo using the mouse, as demonstrated below. Touch interactivity is not currently supported.
Select Dataset
Use the "Select Dataset" dropdown to load a different dataset.
The dataset size is given in parentheses. For example, the name "generated (800x6)" indicates the dataset named "generated" has 800 rows and 6 columns.
Highlight Grid Labels
We start with a traditional scatterplot matrix (SPLOM). Since the cells along the diagonal and lower triangle are redundant, we only draw cells in the upper triangle and rotate the triangle so that it lies in the upper-left quadrant. This leaves room for other controls in the lower-right corner.
Hover over a subplot in the SPLOM to highlight the associated row and column labels on the left and top of the matrix in black. For example, the top-left subplot in the pictured SPLOM shows the variable z in the horizontal direction and v in the vertical direction.
Animation Controls
We continuously loop through the data to animate the SPLOM, redrawing one or more rows of points at a time. The amount of flickering movement indicates the amount of overdraw in a region.
Click the grey play and pause buttons to start and stop the animation at any time.
Use the number input to control how many rows are animated per frame.
The progress bar shows the percent of rows that have been drawn. Once all of the rows have been drawn, the progress bar shows the percent of rows that have been redrawn since the last loop.
Class Legend
We use color to encode the class of each point using a qualitative color scheme adapted from ColorBrewer. The legend can be found in the lower right of the SPLOM.
Click the colored key boxes in the class legend to toggle on/off color for points of that class. This allows you to focus only on classes of interest or disable color entirely.
When toggling on a class color, all points belonging to that class will also be brought infront of other points. If animation is enabled, those points will eventually be redrawn in subsequent animation frames.
Interpretation
To illustrate how to interpret an animated SPLOM, individual subplots from the diamonds dataset will be shown below with a red arrow to highlight the example region.
| Example | Description |
|---|---|
 table vs carat |
An outlier is a single point that is distant from other points. In an animated SPLOM, outliers will appear static (i.e. no movement). |
 x vs depth |
A region with low density has few points and little overdraw. A region with low diversity has few classes. Regions with low density and diversity will have little to no movement or color flickering. |
 depth vs carat |
A region with low density has few points and little overdraw. A region with high diversity has many classes (i.e. many colors). Regions with low density and high diversity have little to no movement but many different colors. |
 table vs depth |
A region with high density has many points and significant overdraw. A region with high diversity has many classes (i.e. many colors). Regions with high density and diversity will have significant movement and significant color flickering. |
Regions with both high density and high diversity will result in the most movement and color flickering, bringing attention to regions that could potentially be misinterpreted due to overdraw in static SPLOMs.
Advanced Usage
Our tool supports the following URL query parameters for advanced users. Default values are provided in bold.
| Parameter | Possible Values | Description |
|---|---|---|
animate |
true, false | If true, enables the animation loop. |
prerender |
true, false | If true, prerenders the entire dataset before the first animation frame. Disabled for very large datasets. |
shuffle |
true, false | If true, shuffles the row order every loop through the dataset. |
shape |
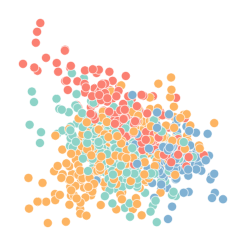
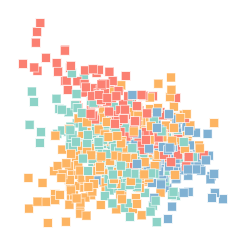
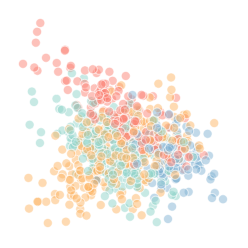
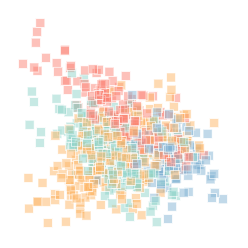
circle, square | Changes the shape drawn for each point. See also the encoding parameter. |
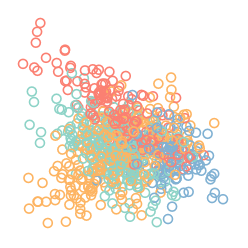
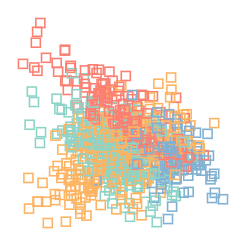
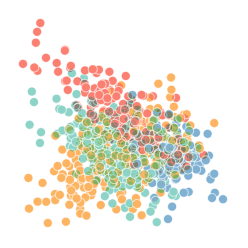
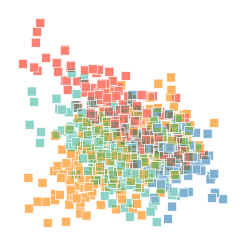
encoding |
normal, open, alpha, blend | Changes the point encoding. If normal, uses a shape filled by class with a white outline. If open, uses a shape with a outline colored by class and no fill. If alpha, uses the normal encoding plus alpha blending (turning on transparency). If blend, uses the normal encoding plus color blending. |
rows |
1, 2, ..., n | A positive integer value that controls the number of rows redrawn every animation frame. Must be less than n, the total number of rows in the dataset. |
scale |
0.75, 1.0, 1.5, ... | A positive floating point value that controls the scale of the SPLOM. Sizes between 0 and 1 will result in a smaller SPLOM, and sizes greater than 1 will increase the SPLOM size. |
Multiple parameters may be combined together using the ampersand & symbol. For example, consider the following:
index.html?prerender=false&shape=square&encoding=open&rows=4&scale=1.25
This set of parameters will disable prerendering, use square shapes with no fill and an outline colored by class, animate 4 rows per frame, and use a 25% larger size for the SPLOM.
Point Encodings
Using the URL parameters above, it is possible to use the following point encodings in our tool:
circle |
square |
|
|---|---|---|
normal |
|
|
open |
|
|
alpha |
|
|
blend |
|
|
Click on any image above to use the shape and encoding values depicted. Some combinations (such as circles combined with color blending) are slower to load.