Visualizing Our Ecological Footprint
Posted Mon Oct 16 2017 by Lance Fernando
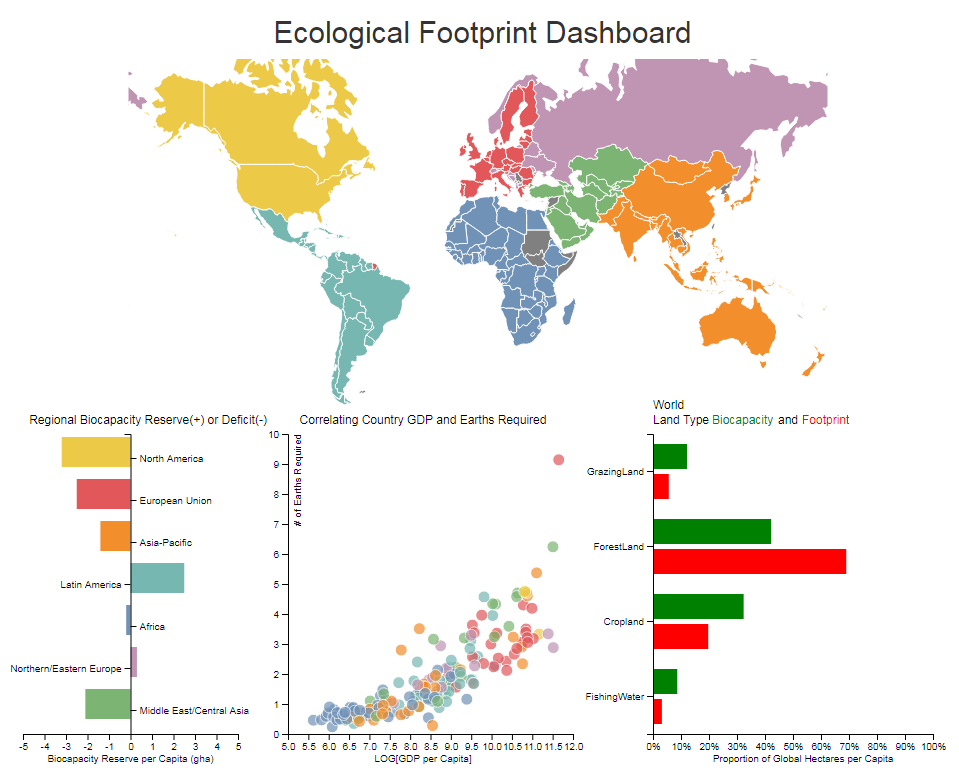
How much of an impact do we really have on the environment? Thanks to the data provided by the Global Footprint Network anyone can calculate their individual ecological footprint as well as see how regional footprints compare around the world. With climate skepticism growing nearly as fast as the CO2 buildup in our atmosphere, it is imperative to use real data and accurate analyses to debunk false assumptions.
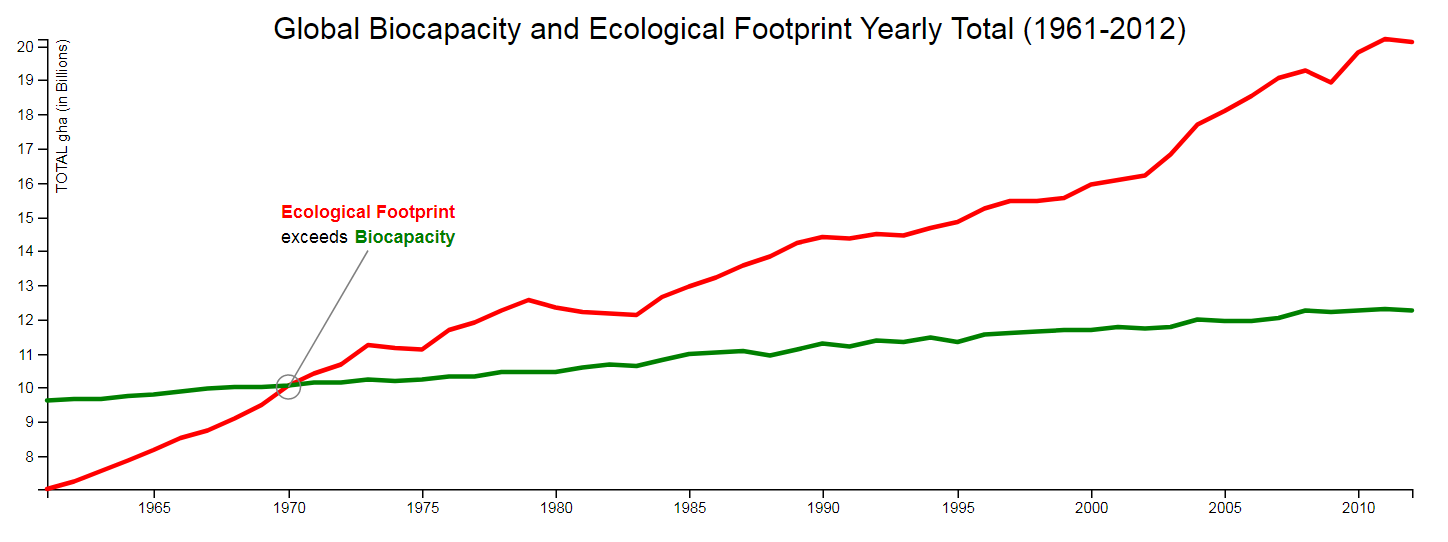
Using d3, I created an interactive dashboard to display a compelling argument against climate-change skeptics, deniers or agnostics alike. The dashboard allows for comparison between regions or countries and displays individual impact using various visualization techniques. The ecological footprint(actual impact) is visualized in conjunction with biocapacity(theoretical max a region/country can sustain). Clearly, the ecological footprint exceeds biocapacity meaning we are using much more than the Earth can withstand. So to all those that remain indifferent about climate-change, check out the dashboard because the data does not lie!