We are thrilled to announce that our paper Using Animation to Alleviate Overdraw in Multiclass Scatterplot Matrices was accepted to the 2018 CHI Conference on Human Factors in Computing Systems (CHI 2018). We will be presenting this work on Thursday April 26th at 11:00am in the Perception in Visualization 2 session in room 519AB in Montréal.
Please check our our project website, which includes a live demo, usage GIFs, and lots of videos and supplementary material (like our user study results). This work was completed by our undergraduate student Helen Chen, USF professors Sophie Engle, Alark Joshi, and Beste Yuksel, as well as external collaborators Eric Ragan and Lane Harrison.
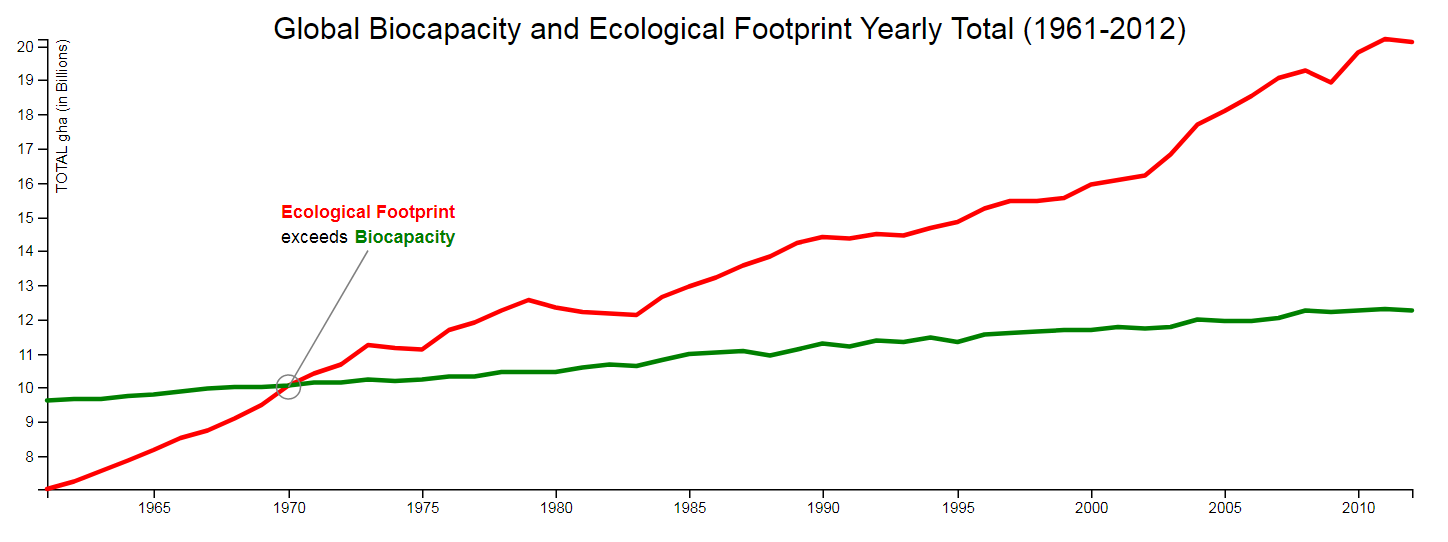
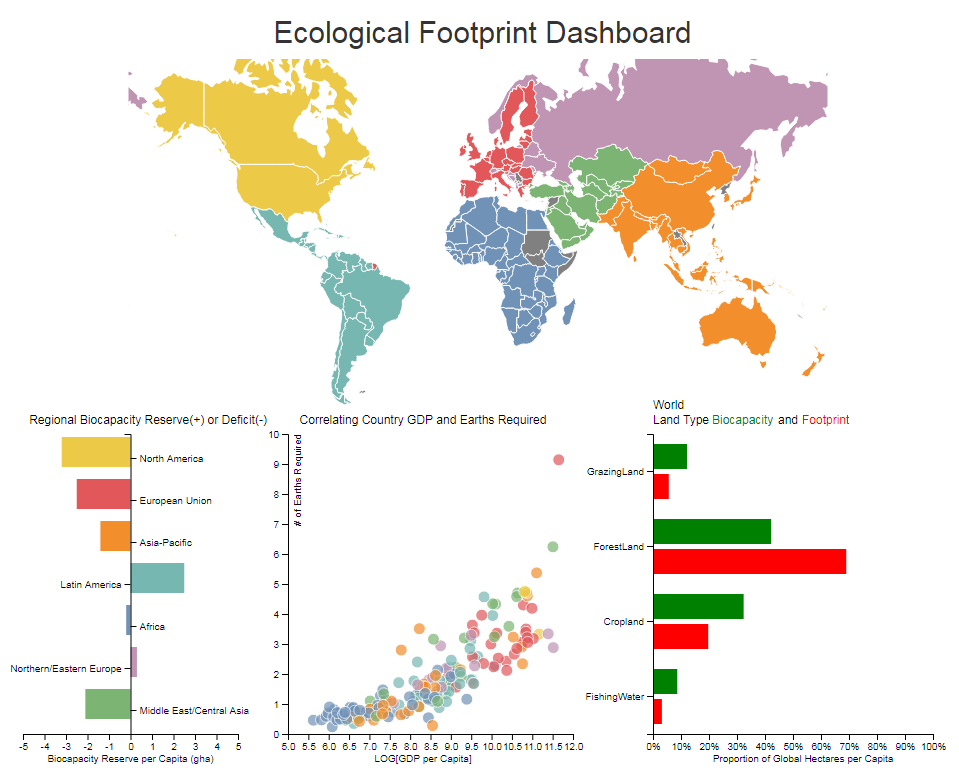
How much of an impact do we really have on the environment? Thanks to the data provided by the Global Footprint Network anyone can calculate their individual ecological footprint as well as see how regional footprints compare around the world. With climate skepticism growing nearly as fast as the CO2 buildup in our atmosphere, it is imperative to use real data and accurate analyses to debunk false assumptions.
Using d3, I created an interactive dashboard to display a compelling argument against climate-change skeptics, deniers or agnostics alike. The dashboard allows for comparison between regions or countries and displays individual impact using various visualization techniques. The ecological footprint(actual impact) is visualized in conjunction with biocapacity(theoretical max a region/country can sustain). Clearly, the ecological footprint exceeds biocapacity meaning we are using much more than the Earth can withstand. So to all those that remain indifferent about climate-change, check out the dashboard because the data does not lie!
We will hold weekly lab meetings in Fall 2017 every Thursday from 2:00pm to 3:00pm in HR 411.
Everyone (even those with little to no visualization background) are welcome to attend, but will be expected to participate. This includes participating in project discussions, presenting and discussing papers, and participating in visualization contests.
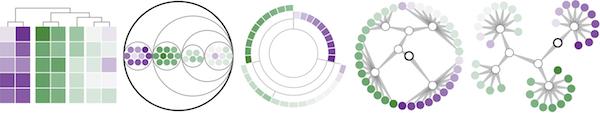
Our open-access paper "Unboxing Cluster Heatmaps" is now published in BMC Bioinformatics, Volume 18 (Supplement 2):63 — Proceedings of the Symposium on Biological Data Visualization at VIS 2016!